
The text of the original article
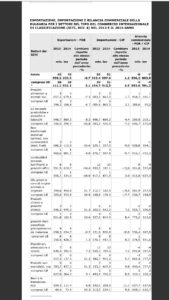
BULGARIA'S EXPORTS, IMPORTS AND TRADE BALANCE BY STANDARD INTERNATIONAL TRADE CLASSIFICATION SECTIONS (SITC, REV. 4) IN 2013 AND 2014 (source: Bulgarian National Statistical Institute)SITC sections Exports - FOB Imports - CIF Trade balance - FOB / CIF2013 2014 Change compared with the same period of the previous year -% 2013 2014 Change compared with the same period of the previous year -% 2013 2014 million lev million lev million lev total 43 559,2 43 233,5 -0.7 50 515,4 51 097.4 1.2 -6 956,2 -7 863,9 including EU 1 26 111.1 26 921.1 3.1 30 164,7 31 512,3 4.5 -4 053.6 -4 591,2 Food and live animals 5 057.2 4 679,1 -7.5 3 603,1 3 663,0 1.7 1 454,1 1 016.1 including EU 3 394.2 3 168,4 -6.7 3 005.6 3 069.2 2.1 388.6 99,2 Non-alcoholic and alcoholic beverages and tobacco 946,7 869,3 -8.2 696,7 666,2 -4.4 250.0 203.1 including EU 356,5 296.5 -16,8 503,2 466,9 -7.2 -146,7 -170,4 Crude materials, inedible (excluding fuel) 3 686,3 3 112,9 -15.6 4 625.1 4 207,0 -9.0 -938,8 -1 094.1 including EU 1 960,6 1 881,5 -4.0 2 876,7 2 597,8 -9.7 -916,1 -716,3 Mineral fuels, lubricants and related materials 6 551.5 5 610,7 -14,4 11 653,3 10 181.1 -12,6 -5 101,8 -4 570,4 including EU 1 505,1 1 234,6 -18.0 1 817,1 1 871,9 3.0 -312,0 -637,3 Animal and vegetable oils, fats and waxes 394,6 440,8 11.7 212.7 182,9 -14.0 181,9 257,9 including EU 303,6 333,9 10.0 168,9 139.0 -17.7 134,7 194,9 Chemicals and chemical products 3 546,3 3 945,3 11.3 6 102.0 6 542,2 7.2 -2 555,7 -2 596,9 including EU 1 851,8 2 102.9 13.6 4 627,0 5 014.9 8.4 -2 775,2 -2 912,0 Manufactured goods classified chiefly by material 9 658,3 9 634,7 -0.2 8 121,9 8 936,8 10.0 1 536,4 697,9 including EU 6 350.6 6 428,3 1.2 5 076.1 5 497,3 8.3 1 274,5 931,0 Machinery, equipment and vehicles 7 830,3 8 392.0 7.2 11 925,3 12 789,5 7.2 -4 095.0 -4 397,5 including EU 5 517,3 6 137.3 11.2 9 382,7 9 915,2 5.7 -3 865.4 -3 777,9 Miscellaneous manufactured articles, n.e.s. 5 783,7 6 437,3 11.3 3 333,3 3 659,8 9.8 2 450,4 2 777,5 including EU 4 827,0 5 264,3 9.1 2 493,9 2 706,0 8.5 2 333.1 2 558,3 Goods and transactions, n.e.s. 104.3 111.4 6.8 242,0 268,9 11.1 -137,7 -157,5 including EU 44.4 73.4 65.3